Welcome to my in-depth exploration of linear regression. While you’ve likely encountered this ubiquitous technique before, I’m dedicating a series to it for one reason.
My understanding of linear regression evolved from something trivial – just finding a line to fit data – to a fundamental tool after diving into econometrics. There’s surprising depth and meaning to uncover, making it a foundation for more advanced regression methods.
I hope you’ll join me on this journey to uncover the power and nuances of linear regression.
And just so you know, I will base my code, formulas and all based on the book “Introduction to Linear Regression Analysis” – Third Edition from the Wiley Series in Probability and Statistics. Here on my website, I only state my findings on the dataset using the techniques, for the code and further formulas notations, I will attach the link to my ipynb files or Kaggle.
Dataset Loading
For our study, we use the Life Expectancy (WHO) dataset on Kaggle: https://www.kaggle.com/datasets/kumarajarshi/life-expectancy-who. Here is a lists of the datasets attributes:
Country: The country for which the data is being reported (object).Year: The year the data is being reported for (int64).Status: Whether the country is considered ‘Developed’ or ‘Developing’ (object).Life expectancy: The average life expectancy in years (float64).Adult Mortality: The rate of adult mortality per 1000 people (float64).infant deaths: The number of infant deaths per 1000 people (int64).Alcohol: The alcohol consumption rate per capita (float64).percentage expenditure: The percentage of government expenditure on health as a percentage of GDP (float64).Hepatitis B: The percentage of children aged 1 year old immunized against Hepatitis B (float64).Measles: The number of reported Measles cases per 1000 people (int64).BMI: The average Body Mass Index of the entire population (float64).under-five deaths: The number of deaths of children under 5 years old per 1000 live births (int64).Polio: The percentage of children aged 1 year old immunized against Polio (float64).Total expenditure: Government expenditure on health as a percentage of total government expenditure (float64).Diphtheria: The percentage of children aged 1 year old immunized against Diphtheria (float64).HIV/AIDS: Deaths per 1000 live births due to HIV/AIDS (float64).GDP: The Gross Domestic Product per capita (float64).Population: The total population of the country (float64).thinness 1-19 years: The percentage of the population aged 1-19 years who are considered thin (float64).thinness 5-9 years: The percentage of the population aged 5-9 years who are considered thin (float64).Income composition of resources: Human Development Index in terms of income composition of resources (float64).Schooling: The average number of years of schooling received (float64).
However, we are not going to use the Country and Year variable, due to which we will drop these two variables:
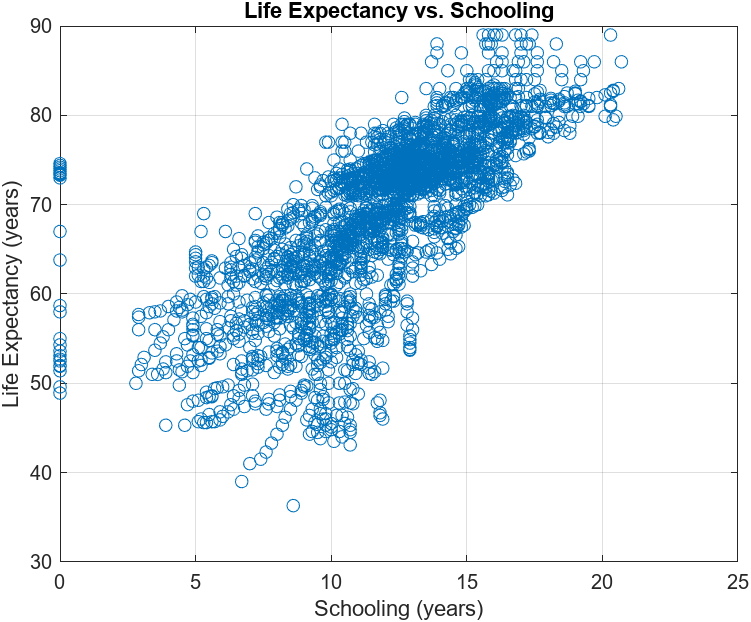
Since the chapter is about simple linear regression, we will only perform a regression analysis to see the relationship between Life Expectancy and Schooling, i.e, whether there is any relationship between these two variables. First, we draw a scatterplot to see whether there is any correlation. The visualization suggests that there be some linear relationship. But we will dive further.
Least-squares estimation of the parameters
Using derivatives to find global extrema, we will see that, if we consider y to be the life expectancy and x to be the number of schooling years received, and consider the relationship between x and y to be a linear equation, I found out an approximation equation:
LifeExpectancy (in years) = 2.289*Schooling (in years) + 41.55
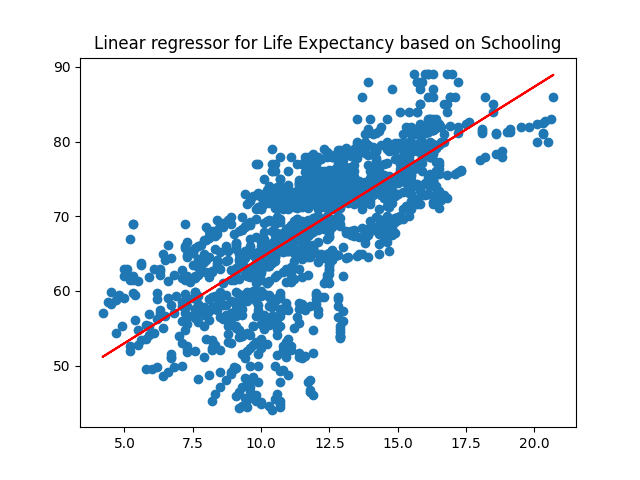
Afterwards, calculating the residual mean square, I obtained that the variance of my prediction for each y based on x would be approximately 36.43, which mean the standard error of regression would be around 6 years, which is not terribly bad considering we are accounting for number of schooling years received only. Of course, we are speaking under the assumption that the variance of prediction is similar for each of the value x in the data range. In order to be sure, it would be wise to conduct the next section.
Hypothesis testing on the slope and intercept
Using the t-tests, with the assumption that the estimated slope is a linear combination of the response values in the datasets, and the the errors are normally distributed, I rejected the null hypothesis, that is there is no linear relationship between Life expectancy and Number of schooling years. The same goes when I tried the F-test for ANOVA analysis instead.
Interval estimation in simple linear regression
In the end, using the assumption of normal error distributions, I see that the interval for my beta_1 value, which is the coefficient of Number of schooling years in the regression equation is (2.185456348228645, 2.394116692685223) with confidence level 95%, this means our quality of regression, under the conditions that the assumptions are true, is pretty nice.
Also, the variance of the estimation of response for each value of x with confidence level 95% is the interval
(34.06976268136923, 39.058074347577495)
And finally, the coefficient of determination of the regression model is roughly 0.5, which means approximately half of the variance in the response values.
Welp, that is all there is to it, when we are just basing on one variables. Here is the link to my files: https://www.kaggle.com/code/ticphan/simple-linear-regression